
What we recorded and what we recalculated
The actual game session contains 3,000 settled measured drops, plus ten setup drops excluded from every published sample. Low came first, then Normal, then High. Each profile contains exactly 1,000 one-FUN bets at 16 rows. We retained the pocket, multiplier, returned amount and balance change for every accepted result. The collected outcomes are separate observations, not generated simulator rows or another project’s sample.
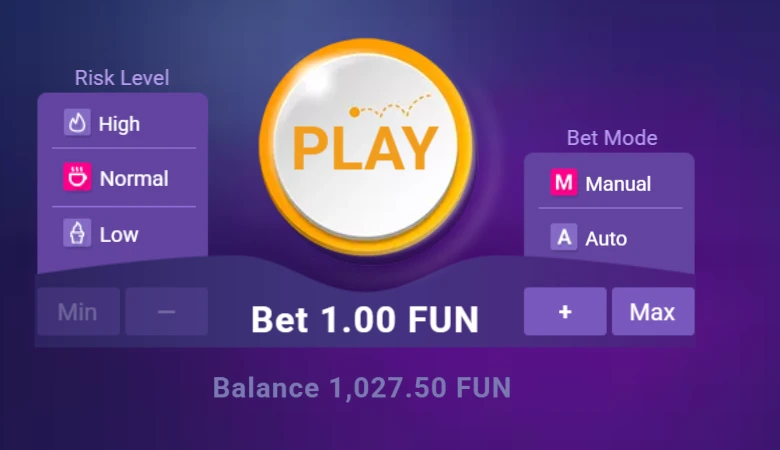
The sequential order matters. We did not randomise risk settings between drops or test three funded accounts simultaneously. This is an international public demo with virtual credits, not a physical-location test of an Italian operator. Fast inputs can leave the visible animation behind the already-settled results, so we reconciled the server-reported balance chain and checked the final idle balance after the run. The screenshots document controls and history, not a substitute tally of moving balls.
Strategy replays use those recorded pockets with hypothetical stakes. We did not place ten different live strategies on each ball. The replay starts with 500 FUN, a 1 FUN base and a 64 FUN cap. A stake above the remaining bank or cap stops that rule before the next drop. Returns are rounded to the nearest cent of FUN and percentage stakes are rounded down. These choices are part of the result, not adjustable explanations added afterwards.
Observed RTP: three samples, three different paths
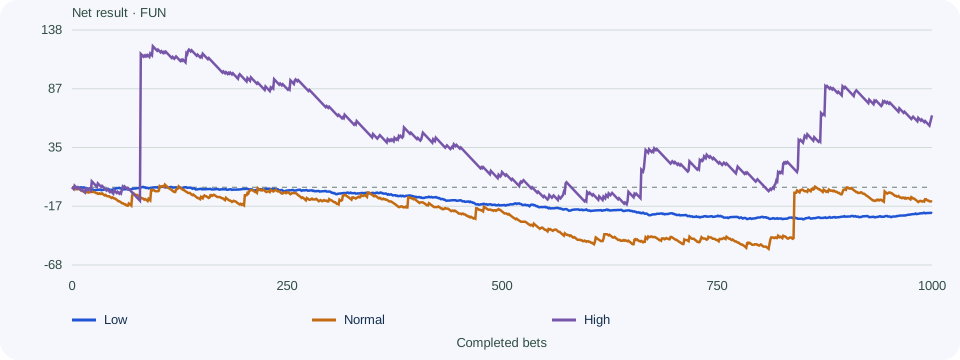
Low returned 977 FUN from 1,000 FUN staked: observed RTP 97.7% and net −23 FUN. Normal returned 987.1 FUN: 98.71% and −12.9 FUN. High returned 1,063.2 FUN: 106.32% and +63.2 FUN. These are measured sample ratios, not a revision of the theoretical payout tables. High finishing above 100% does not mean the game has a positive long-run expectation.
High had 224 profitable drops and 776 losing drops, with no break-even outcome in its table. The largest observed multiplier was 130×, not the 1,000× maximum printed at the edges. Low’s largest observed multiplier was 2×; Normal’s was 41×. A table can contain a rare outcome that never appears in a thousand-drop sample. Reporting the table maximum as our observed win would be wrong.
The longest measured losing runs were 3 drops on Low, 11 on Normal and 23 on High. Here “losing” means a multiplier below 1×. A Low break-even drop interrupts that consecutive-loss count, even though our Martingale rule keeps its stake level on break-even. This distinction explains why a losing-streak statistic alone cannot reconstruct a progression’s maximum level.
The graph starts each risk curve at zero so their net changes can be compared. It does not claim that the live demo opened a fresh wallet between settings. Horizontal position counts completed drops within that risk; vertical position is net FUN. High’s early rise followed by a long decline is a useful warning against judging a configuration only at the most flattering stopping point.
A closer look at the 100-drop windows
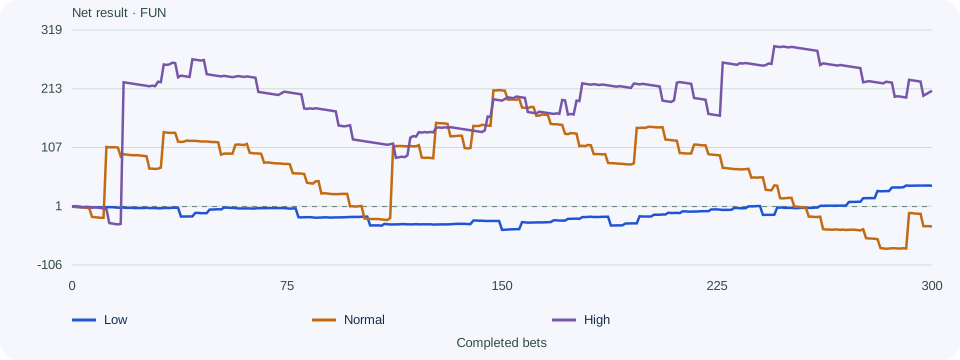
The High sample’s first 100 drops gained 121 FUN. The next five 100-drop blocks lost 25.6, 25.4, 26.8, 29.8 and 18.4 FUN respectively. Drops 801–900 then gained 82.8 FUN, before the final hundred lost 24.2. Selecting only the opening or the late positive block would tell a very different story from preserving the whole sequence. These are descriptive windows fixed at round-number boundaries, not entry signals.
Normal’s largest positive 100-drop block was also 801–900, at +48.6 FUN. That does not establish a shared time pattern: the profiles were collected sequentially, and the indices refer to positions inside different samples. We did not test clock time as a predictor. The shared index is a convenient reporting boundary, not evidence that every game improves after eight hundred drops.
Ten ordinary systems: completion matters
The ten baseline rules are fixed stake, percentage of balance, Martingale, capped Martingale, D’Alembert, Fibonacci, Paroli, 1–3–2–6, stop limits and restart after a limit. The last two use fixed stakes and thresholds of 15 FUN, not 15%. Stop limits finish the run at the first crossed threshold. Restart begins another cycle with the remaining balance, without a deposit or erased loss.
In the High sample, D’Alembert reported +4,934 FUN after only 126 bets, then hit the stake cap. That is a genuine replay result but not a completed 1,000-bet strategy. Capped Martingale reached all 1,000 with +1,173.2 FUN and 967 FUN drawdown. The fixed rule ended +63.2 with 139 FUN drawdown. These results describe different turnover and paths, so a profit-only ranking would hide essential differences.
Normal gives another useful contrast. The 1–3–2–6 rule completed the sample at +22.9 FUN, while capped Martingale completed it at −201.1 FUN. Ordinary Martingale stopped after 56 bets at −71 FUN. A familiar system name does not carry a stable result from one risk or history to another. Open the individual strategy graphs to see the stop point beside the final figure.
A drawdown can exceed the starting bank if the balance first rises substantially. High’s fitted rule starts at 500 FUN but can later fall more than 4,000 FUN from a much higher peak while remaining solvent. Therefore drawdown is not the same as a required initial bankroll. Inspect the full path before interpreting either number.

The 300-setting search and its actual instructions
We searched five lookback windows: 6, 10, 14, 18 and 24 paid drops. We combined them with maximum centre counts of 0 through 4, raised total stakes of 4, 8, 16 or 32 FUN, and cooldowns of 0, 4 or 9 base-stake drops. That gives 300 combinations per risk. The base remains 1 FUN, the bank 500 and the cap 64. We rank only candidates that finish the complete target segment, by net result and then drawdown and raised stake for ties.
For the Low winner, count exact centre-pocket 8 results in the previous 18 paid drops. If there are at most three, stake a total of 32 FUN on the next drop. Then make four base-stake drops before the next trigger can be considered. Otherwise keep staking 1 FUN. This completed the thousand-drop history at +60.7 FUN, from 4,503 FUN turnover, with 107 FUN drawdown. There is no free waiting period.
Normal’s all-history winner uses a six-drop window, at most one centre, a 32 FUN raised stake and nine cooldown drops. It ends +864.4 FUN on 3,635 FUN turnover, with 375.4 FUN drawdown. High uses six drops, at most three centres, 32 FUN and no cooldown. Its +2,258 FUN accompanies 31,349 FUN turnover and 4,355 FUN drawdown. The High rule raised the stake very often; the large profit is not a low-exposure shortcut.
The search knows the whole sample when choosing the winning settings. Individual betting decisions use only preceding pockets, but that does not remove the selection bias introduced by testing 300 alternatives. Calling this “no look-ahead” without explaining the search would be misleading. The honest label is a historical fit worth investigating, with the full exposure visible.
A second search using stakes the actual buttons offer
The live controls step through 1, 2, 3, 5, 10, 15, 20, 30, 50, 75 and 100 FUN. There is no 32 FUN choice. We therefore ran another 300-combination grid per risk, replacing the four raised amounts with 5, 10, 20 and 30 FUN. The same recorded pockets, 500 FUN bank and selection method remain. This separates a mathematical system from an amount you can actually select.
The best complete fits use 30 FUN when triggered: Low 18/3/30/4 gives +55.3 FUN on 4,277 FUN turnover, drawdown 101.6; Normal 6/1/30/9 gives +807.8 on 3,465 turnover, drawdown 354.4; High 6/3/30/0 gives +2,116.4 on 29,391 turnover, drawdown 4,083. The code order is previous drops / maximum centre hits / total raised stake / cooldown drops.
Selecting this new grid on the first 700 and freezing it for the last 300 gives +35.2 FUN on Low, −31.5 on Normal and +198.6 on High. Their fixed settings are 18/3/30/4, 6/3/30/4 and 10/1/30/4 respectively. The check again starts with 500 FUN and an empty window. This second grid was added after inspecting the first results, so it is another retrospective comparison, not a prospectively registered trial.
A separate 700/300 check
For this calculation we select the best completing rule using only drops 1–700. We then freeze its parameters and apply them to drops 701–1,000. The check starts with a fresh comparison bank of 500 FUN and an empty observation window. It is not a continuation of the training wallet. The parameters can differ from the all-history winners because the selection data differ.
Low selected the same 18/3/32/4 settings: +23.1 FUN during selection and +37.6 in the last 300, with 42 FUN check drawdown. Normal selected 6/3/32/4: +717.4 during selection but −35.9 in the check, with 286.9 FUN drawdown. High selected 10/1/32/4: +1,031.8 during selection and +209.4 in the check, with 178.2 FUN drawdown. All three completed their 300 check drops.
Two positive checks are encouraging examples, not a demonstration of a lasting edge. We have one held-out segment per risk and the entire experiment is retrospective. Repeatedly changing the method after viewing these outcomes would turn the check into more training data. A genuinely new test would lock the rule and evaluation conditions before collecting another untouched sequence.
Why a positive check still needs another sample
A single result cannot measure how often a rule will finish ahead. For that question we would need many independent evaluation samples with the same rule frozen in advance. Reusing the same last 300 drops after adjusting the lookback window no longer answers it. The evaluation sample has influenced the decision, even if the software still labels the button “test”. Keep a record of each attempted rule, not only the one eventually retained.
The Low rule happened to be selected by both the full-history and first-700 searches. Normal and High selected different settings. That agreement on Low is an observed property of this corpus, not evidence that its rule was chosen before any data existed. The public tables preserve both procedures so a reader can see which parameters belong to which claim.
Parameters selected on the first 700, checked on the final 300
| Risk | Previous paid drops to count | Maximum centre hits | Triggered TOTAL stake ·FUN | Base-stake drops after a raised bet | Net result | Largest fall from a peak |
|---|---|---|---|---|---|---|
| Low | 18 | 3 | 32 FUN | 4 | +37.6 FUN | 42 FUN |
| Normal | 6 | 3 | 32 FUN | 4 | −35.9 FUN | 286.9 FUN |
| High | 10 | 1 | 32 FUN | 4 | +209.4 FUN | 178.2 FUN |
Repeat a calculation and read its limitations
Open a settings link from the search table to reproduce the full-history fit in the simulator. The default data source is the recorded sample. Changing to generated practice produces a mathematical sequence with a chosen seed; it must not be described as another measured demo run. Download the CSV to inspect each stake, pocket, return and balance rather than relying on the final chart alone.
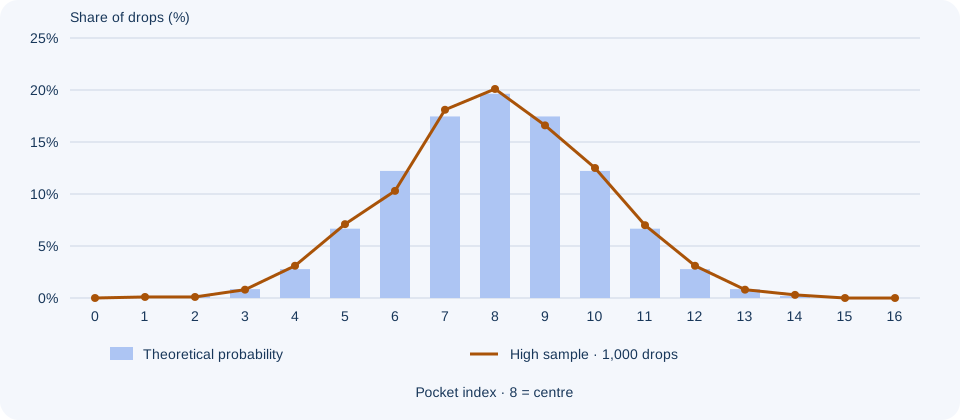
At 16 rows the chance of either extreme pocket in one drop is 1 in 32,768. Across 1,000 independent drops the chance of seeing at least one is only about 3.01%. The absence of a 1,000× High outcome is therefore unsurprising. A thousand drops also cannot settle a high-variance long-run RTP claim. Our probability guide explains the discrete bell-shaped distribution and why rare missing outcomes remain rare on the next drop.
The useful conclusion is specific: we found profitable historical rules, saw different results after freezing a rule on a shorter segment, and can show exactly what each calculation did. That gives a reader something to inspect. It does not establish operator availability, cash payment reliability or a way to know the next pocket. Those are different questions and require different evidence.
Data licence
Rights reserved in this editorial compilation. You may inspect the records for personal analysis; contact the editors before redistributing them. Provider artwork and software are not licensed by this page.