
The binomial maths behind every drop
A Plinko board with 16 rows forces the ball through 16 binary decisions. At each peg it deflects left or right with equal probability, and each decision is independent of the ones before it. The final pocket is therefore determined by how many of the 16 deflections went, say, right. Counting right-deflections gives a classic binomial distribution: Binomial(16, 0.5).
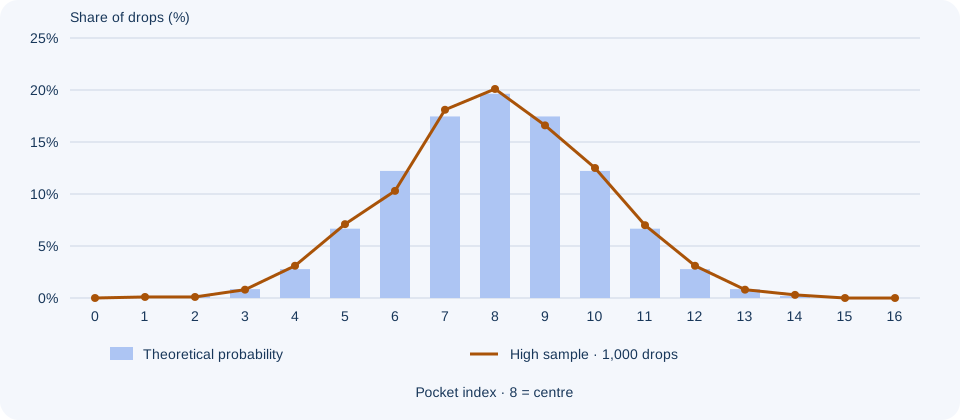
There are 17 pockets, indexed 0 to 16. Pocket k is reached by exactly C(16, k) different bounce paths out of 2^16 = 65,536 equally likely paths. So the probability of pocket k is C(16, k) / 65,536. The centre pocket, index 8, has the most paths: C(16, 8) = 12,870, giving 12,870 / 65,536 ≈ 19.64%. The extreme pockets, index 0 and 16, each have exactly one path, so each sits at 1 / 65,536 ≈ 0.00153%.
This is the exact discrete distribution, not an approximation. You may have seen the bell curve described as a 'normal distribution'; the normal curve is only a convenient approximation of the binomial. With 16 rows the approximation is decent near the centre but noticeably off at the tails, where the rare big multipliers live. For edge pockets, always use the exact binomial figure: the normal approximation can misstate tail probabilities by a meaningful margin.
The landing vector is symmetric: pocket 1 has the same probability as 15, pocket 2 as 14, and so on. The captured payout tables are also symmetric. Those are two separately checked properties; a symmetric probability distribution does not require every possible game to choose symmetric payouts.
| Pocket (each listed index separately) | Paths C(16,k) | Probability per pocket (rounded) | Approx. frequency |
|---|---|---|---|
| 0 or 16 (edge) | 1 | 0.0000153 (1/65,536) | 1 in 65,536 drops |
| 1 or 15 | 16 | 0.000244 | 1 in 4,096 |
| 2 or 14 | 120 | 0.001831 | 1 in 546 |
| 3 or 13 | 560 | 0.008545 | 1 in 117 |
| 4 or 12 | 1,820 | 0.027771 | 1 in 36 |
| 5 or 11 | 4,368 | 0.066650 | 1 in 15 |
| 6 or 10 | 8,008 | 0.122192 | 1 in 8.2 |
| 7 or 9 | 11,440 | 0.174561 | 1 in 5.7 |
| 8 (centre) | 12,870 | 0.196381 | 1 in 5.1 |
One edge versus either edge: how rare is rare
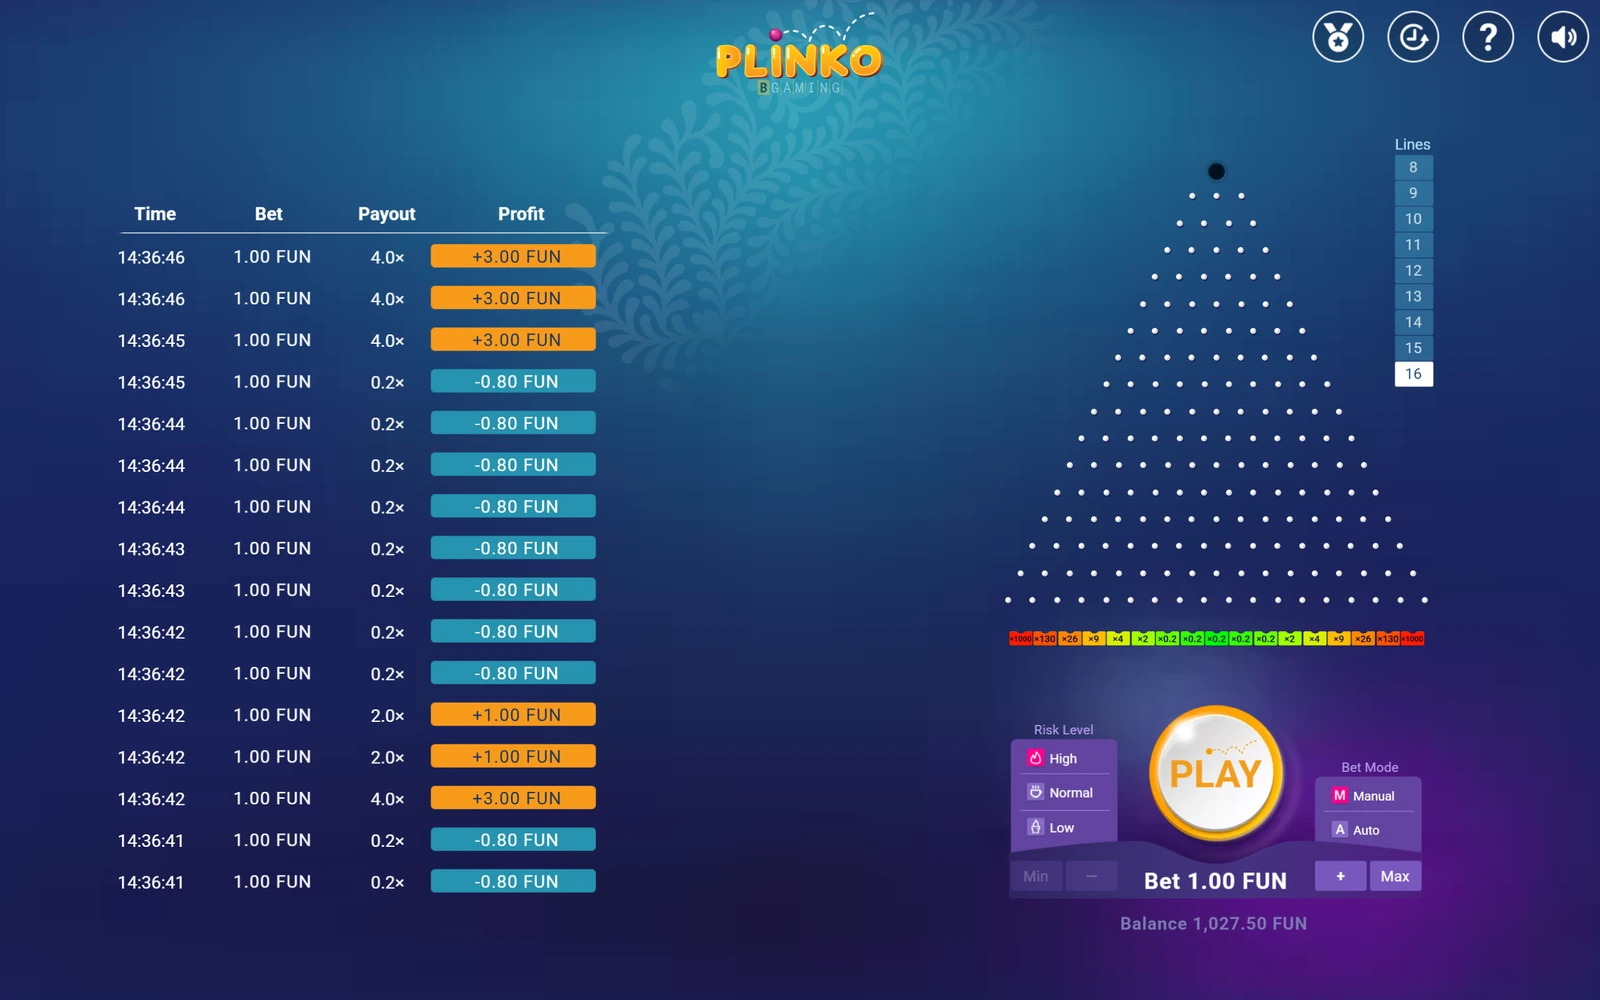
The headline multipliers — 16x on Low, 110x on Normal, 1000x on High — live only in the two outermost pockets. Hitting one specific edge (say, the far-left 1000x) requires all 16 bounces to go the same way: probability 1/65,536. Hitting either edge combines both outer pockets: 2/65,536 = 1/32,768.
Put in play-time terms: at a brisk manual pace of 10 drops per minute, one specific edge would appear on average once every 6,554 minutes — over 109 hours of continuous clicking. Even the combined 'either edge' figure averages once per 32,768 drops. These are long-run averages, not schedules; the next section explains why.
Pocket 1 is 16 times as likely as pocket 0; pocket 2 is 120 times as likely. The five central pockets, indices 6–10, together account for 78.9886% of the probability, not a guaranteed count in a short sample. Across 1,000 drops, the chance of at least one extreme-edge result is 1 − (1 − 1/32,768)^1,000, approximately 3.01%. A rare result is possible, but absence is the much more likely outcome in that sample.
RTP and expected value on each risk level
The landing probabilities are identical on Low, Normal and High risk — same board, same binomial vector. What changes is the multiplier table, and therefore the expected value, the volatility and the shape of a typical session. Expected value per drop is simply the sum of each multiplier weighted by its pocket probability.
The exact theoretical RTP is 98.9987% on Low, 98.9883% on Normal and 98.9764% on High at 16 rows. The corresponding expected loss rates are approximately 1.0013%, 1.0117% and 1.0236% of turnover. There is a small value difference, roughly 0.0223 percentage points between Low and High; the much larger practical difference is the variability of returns.
Low has 45.4498% probability of a net profit, 34.9121% of break-even at pockets 7 and 9, and 19.6381% of a loss at centre pocket 8. High has 21.0114% probability of profit and 78.9886% of a loss; all five central pockets pay 0.2×. The labels profit, break-even and loss compare the return with the stake, not with zero.
Standard deviation quantifies the swing: 0.33x stake on Low, 1.47x on Normal, 6.57x on High. A High-risk session is roughly twenty times as volatile per drop as a Low-risk one at the same stake. If you want to explore how these profiles feel over hundreds of drops, the Plinko stake simulator replays them drop by drop, and the settings guide walks through what each control actually changes.
| Profile | Theoretical RTP | Profit probability | Break-even probability | Loss probability | Std deviation | Max multiplier |
|---|---|---|---|---|---|---|
| Low | 98.9987% | 45.45% | 34.91% | 19.64% | 0.33x | 16x |
| Normal | 98.9883% | 21.01% | 24.44% | 54.55% | 1.47x | 110x |
| High | 98.9764% | 21.01% | 0% | 78.99% | 6.57x | 1000x |
Partial returns: a 0.2x 'hit' is still a loss
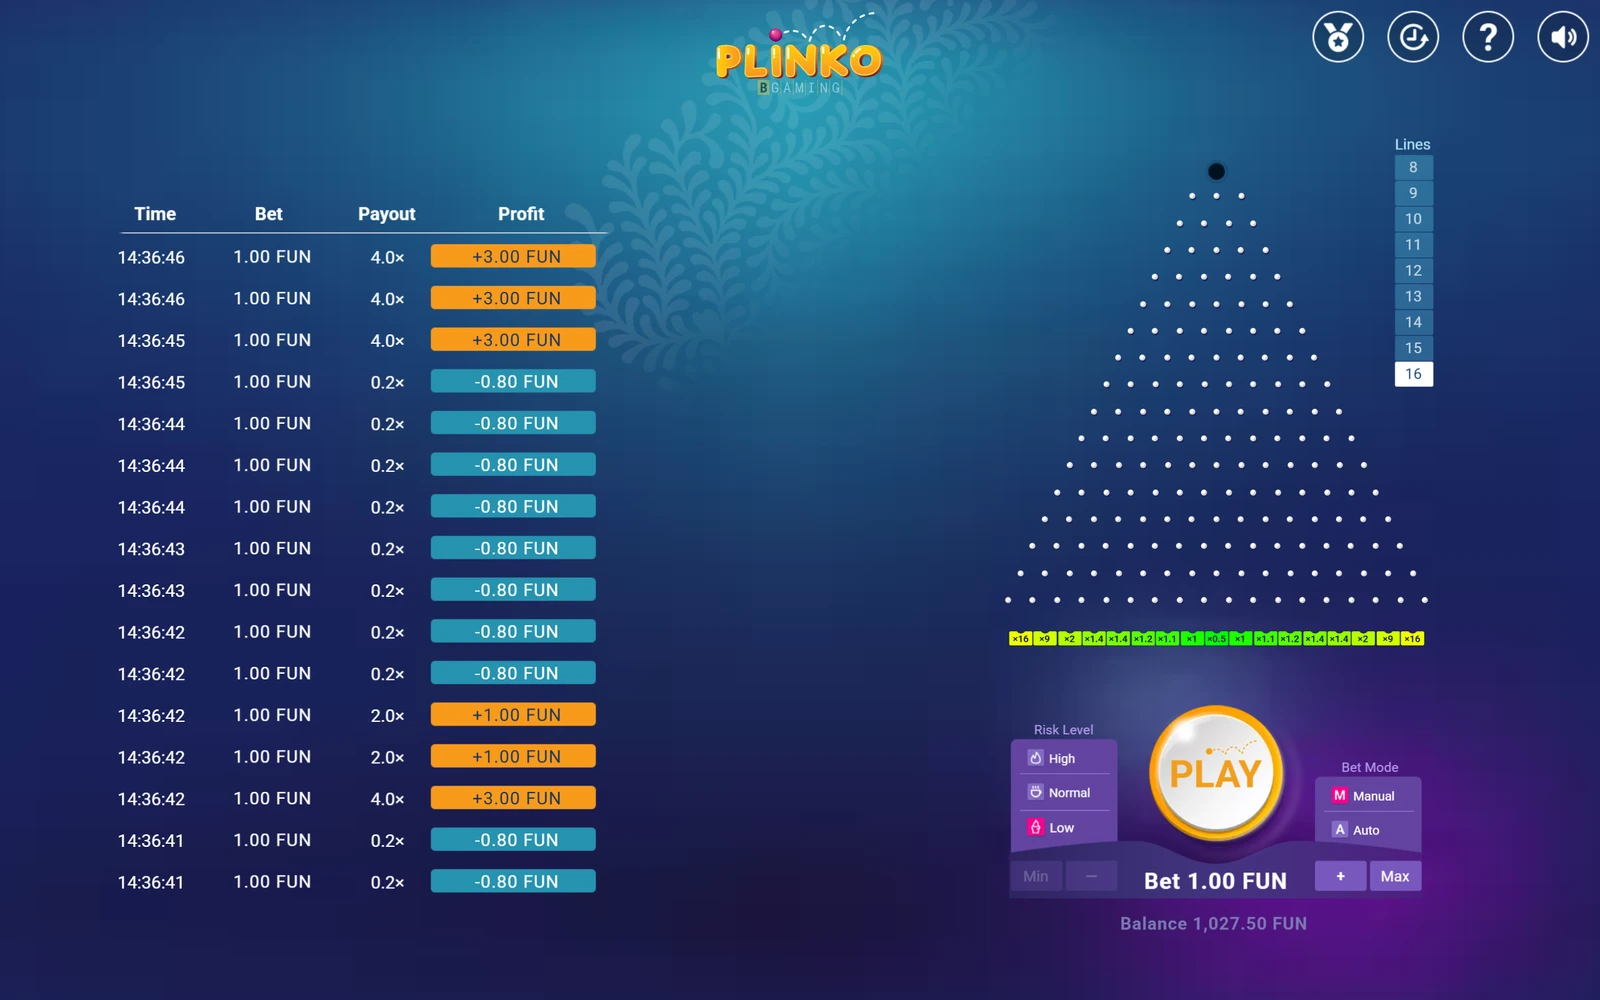
On High, five central pockets return 0.2×. A 2 FUN stake therefore returns 0.40 FUN and loses 1.60 FUN net. The animation may show a credited amount while the balance still falls. Compare the returned amount with the stake to decide whether the drop was profitable.
This matters for how you read any session. Twenty consecutive High-risk drops at 1 FUN each, all landing at 0.2x, cost 16 FUN from a 100 FUN balance — not 20, and certainly not the whole balance, but a steady bleed that the win animations disguise. Gross return and net result are different numbers; only the net figure moves your balance.
A 1 FUN Martingale with a 64 FUN cap permits seven stakes totalling 127 FUN. If all seven High results pay 0.2×, the net is −101.60 FUN and the next 128 FUN stake is blocked. Six such stakes total 63 FUN and lose 50.40, but do not yet reach that stopping point. The Martingale page separates these cases and explains why small positive returns may also fail to recover a chain.
The practical habit to build: after every drop, look at the balance change, not the payout banner. In the official FUN demo you can do this risk-free — the demo uses virtual FUN credits with no cash value, so it is the right place to calibrate your intuition before ever thinking about real-money play.
Rare hits are never due: independence of drops
Each drop is generated independently. The board has no memory of where the last ball landed, no counter tracking how long since an edge hit, and no mechanism that makes a 1000x more likely after a dry spell. If the true probability of either edge is 1/32,768 per drop, it remains 1/32,768 on drop one and on drop fifty thousand.
The gambler’s-fallacy version of this mistake says: 'I’ve dropped 30,000 balls without an edge, so it must be close.' It is not. The probability of at least one edge hit in the next 32,768 drops is about 63.2% — the same whether you are fresh or deep into a drought. Long streaks without rare events are not anomalies; they are exactly what the distribution predicts. In fact, going 100,000 drops without a single edge has a probability of roughly 4.7%, which means across many players it happens constantly.
The mirror-image mistake is the hot-hand version: raising stakes because edges 'seem to come in clusters'. Clusters of rare events are also normal in independent sequences. Neither observation carries predictive information. Claims you may see in forums — that changing the seed, tapping in bursts, or increasing the stake after low returns influences outcomes — are not verified predictive advantages, and our predictor page explains why no tool can forecast an independent random drop.
What you can legitimately control is exposure: stake size, risk level, number of drops, and a stop point. Those decisions shape your variance and your expected loss (about 1.02% of everything you stake), but nothing you do between drops shifts the probabilities themselves.
Calculate any Plinko odds yourself
Worked example: you plan 200 drops at 1 FUN on High risk. Turnover is 200 FUN, expected loss is about 200 × 0.01024 ≈ 2.05 FUN. But the standard deviation of a single drop is 6.57x, so your actual result can land far from that average in either direction — that is the entire point of the High profile. For a hypothetical real-money framing: if each FUN were hypothetically €1, the same arithmetic would imply an expected cost of about €2.05 on €200 staked. This is a hypothetical illustration only, not a measured result — the official demo uses virtual FUN with no cash value, and no real-money play was tested for this article.
If you would rather not build the spreadsheet, the simulator applies these exact probabilities and lets you test flat staking, percentage staking and progression systems against them. For the underlying game mechanics, see how to play and the free FUN demo, and for the full strategy landscape the strategies hub ties the maths to practical bankroll rules.
- Write the pocket probabilities: for pocket k of 16, compute C(16, k) / 65,536. In a spreadsheet, =COMBIN(16,k)/65536.
- List the multiplier for each pocket from the game’s paytable for your chosen risk level.
- Expected value: multiply each multiplier by its pocket probability and sum all 17 products. That sum is the mean return per 1 unit staked — around 0.9898 on High risk.
- Probability of profit: add the probabilities of every pocket whose multiplier exceeds 1.0. On High risk that is the 2x, 4x, 9x, 26x, 130x and 1000x pockets: about 21.0%.
- Probability of a specific rare event: for 'either edge', add pocket 0 and pocket 16: 2/65,536. For 'at least one edge in N drops', compute 1 − (1 − p)^N with p = 1/32,768.
- Expected session cost: multiply your planned total turnover (stake × number of drops) by the house edge of about 1.02%. That is the long-run average cost — individual sessions will deviate widely, especially on High risk.
Common questions
What is the RTP of BGaming Plinko?
At 16 rows the captured tables give 98.9987% Low, 98.9883% Normal and 98.9764% High theoretical RTP. These are mathematical averages over the full distribution, not measured promises for a session.
What are the odds of hitting the 1000x multiplier?
The 1000x sits in both outermost pockets on High risk. One specific edge pocket has probability 1/65,536 per drop; hitting either edge combines to 1/32,768. At 10 drops per minute, a specific edge averages over 109 hours of continuous play.
Is Plinko a normal distribution or binomial?
Exactly binomial: 16 independent 50/50 bounces give Binomial(16, 0.5). The bell curve looks normal, and the normal approximation works near the centre, but it misstates the tails — where the big multipliers are — so use exact binomial figures for edge odds.
If I haven’t hit an edge in thousands of drops, is it due soon?
No. Drops are independent; the board has no memory. The probability stays 1/32,768 for either edge on every drop, regardless of history. Long droughts and clusters are both normal features of independent random sequences.
Why does my balance fall even when the ball 'pays out'?
A return below 1× credits only part of the stake. High’s five central pockets pay 0.2×: 1 FUN returns 0.20 and loses 0.80 net. Low has only one losing pocket at 16 rows, so do not generalise High’s frequency to every risk.
Which risk level gives the best chance of winning a drop?
Low risk: about 45.4% of drops return more than stake, plus 34.9% breaking even at 1x. High risk profits on only 21.0% of drops but offers the 1000x ceiling. Expected value is nearly identical, so choose based on the swings you can tolerate.